Graphs and charts are important tools for the analysis of data. In this tutorial, you will look at how to represent data in terms of a bar chart and pie chart. To make this possible, we need the latest rendition of Microsoft's Graphics Device Interface (GDI+).

Scenarios to draw bar and pie charts
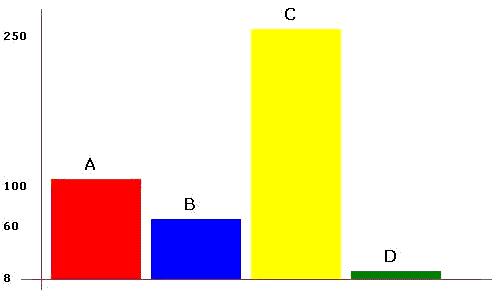
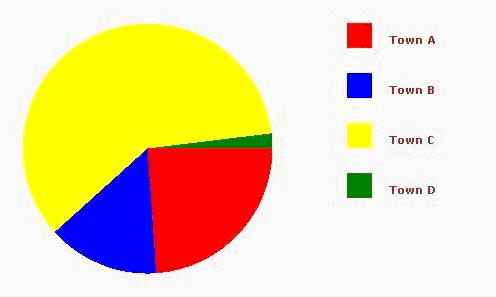
In this bar and pie chart example, it will represent the data of a fictitious country having 4 towns; namely: Town A, Town B, Town C and Town D. Their population will be modeled in terms of graphs and charts. The figures are given below:
Town Population
A 1,000,000
B 600,000
C 2,500,000
D 800,000
Then, the bar chart should be outputted like this:
And the pie chart should be outputted like below:
Useful classes
Below are some of the useful classes that will be used to achieve what you want:
The Bitmap class
In windows application, you would have output graphical contents to one of the windows. Whereas in ASP.NET, there are no window. Fortunately, there is a class that can act as the drawing surface and that is the Bitmap class.
As any drawing surface has a width and a height, so does the Bitmap object. So, when we will create a Bitmap object, we will pass in a width and a height as parameters in the constructors. Moreover, we have to specify “Pixel Format Argument” which means whether the pixel format should be 24-bits RGB color, 32-bits RGB color, GDI-colors etc. In short the following code will do the work.
Dim Image As New Bitmap(500, 300, PixelFormat.Format32bppRgb)
The Graphics Class
Once you have created the Bitmap object, you need to obtain a Graphics object that references that Bitmap object. The following code will do the job.
' Get the graphics context for the bitmap.
Dim g As Graphics = Graphics.FromImage(Image)
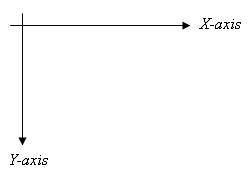
The x vs. y coordinates system is illustrated in the figure below:
The Drawer
Now that you have a surface to draw, as you may have guessed, you will need a pen or brush to draw. To create a pen, a few properties of the pen should be specified; like the color of the pen and the width of the pen..
' Create a pen for drawing
Dim redPen As New Pen(Color.Red, 10)
' Create a blue brush
Dim blueBrush As New SolidBrush(Color.Blue)
Useful methods for drawing
Now that we have a set of drawing tools at our disposal, the graphics class also has a set of interesting methods to simplify our work for drawing objects like: circles, rectangles, text and the list goes on.
For this tutorial, you will be using the following self explanatory methods:
- Clear ( ): Cleans the graphics object (Pretty much like cleaning the whiteboard)
- DrawString ( ): For outputting text
- FillPie ( ): Draw a pie slice (useful for pie chart)
- FillRectangle ( ): Draws a rectangle (useful for bar charts)
- DrawLine ( ): Draws a line
The above methods may be overloaded, so we used the names only. It is left to you as an option to explore how the overloaded methods.
How to Code the Chart Generator functions
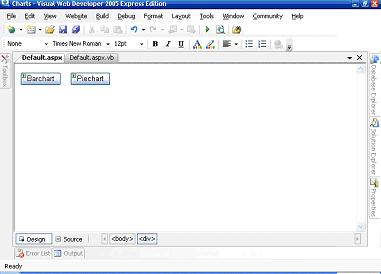
Step 1
First of all create 2 buttons and label them Barchart and Piechart as shown in the figure below:
Step 2
Next, we shall declare some variables for the Bitmap object, Graphics object, population values, town names and the color representing each town. The code is as follows:
' Variables declaration
Private myImage As Bitmap
Private g As Graphics
Private p() As Integer = {1000000, 600000, 2500000, 80000}
Private towns() As String = {"A", "B", "C", "D"}
Private myBrushes(4) As Brush
Next, in our Page_Load event, we will call a function that will create objects from the Bitmap and Graphics classes. We should also create the brushes that will be used for drawing the charts. The code snippet below does the job:
' Create an in-memory bitmap where you will draw the image.
' The Bitmap is 300 pixels wide and 200 pixels high.
myImage = New Bitmap(500, 300, PixelFormat.Format32bppRgb)
' Get the graphics context for the bitmap.
g = Graphics.FromImage(myImage)
' Create the brushes for drawing
myBrushes(0) = New SolidBrush(Color.Red)
myBrushes(1) = New SolidBrush(Color.Blue)
myBrushes(2) = New SolidBrush(Color.Yellow)
myBrushes(3) = New SolidBrush(Color.Green)
Step 3
The bar charts have to be placed in a manner that we could draw the axes and label them as well. So, we declare an interval variable that will space the bar charts.
' Variables declaration
Dim i As Integer
Dim xInterval As Integer = 100
Dim width As Integer = 90
Dim height As Integer
Dim blackBrush As New SolidBrush(Color.Black)
For i = 0 To p.Length - 1
height = (p(i) \ 10000) ' divide by 10000 to adjust barchart to height of Bitmap
' Draws the bar chart using specific colours
g.FillRectangle(myBrushes(i), xInterval * i + 50, 280 - height, width, height)
' label the barcharts
g.DrawString(towns(i), New Font("Verdana", 12, FontStyle.Bold), Brushes.Black, xInterval * i + 50 + (width / 3), 280 - height - 25)
' Draw the scale
g.DrawString(height, New Font("Verdana", 8, FontStyle.Bold), Brushes.Black, 0, 280 - height)
' Draw the axes
g.DrawLine(Pens.Brown, 40, 10, 40, 290) ' y-axis
g.DrawLine(Pens.Brown, 20, 280, 490, 280) ' x-axis
Next
The above code has only to be linked with the Click event of the “Barchart†button that was placed ok the page before. We have to keep track of the total angle so far and add the current angle produced by population[i] and use the FillPie method to draw the piechart.
Step 4
Next, to draw the pie chart, we make use of the following code:
' Variables declaration
Dim i As Integer
Dim total As Integer
Dim percentage As Double
Dim angleSoFar As Double = 0.0
' Caculates the total
For i = 0 To p.Length - 1
total += p(i)
Next
' Draws the pie chart
For i = 0 To p.Length - 1
percentage = p(i) / total * 360
g.FillPie(myBrushes(i), 25, 25, 250, 250, CInt(angleSoFar), CInt(percentage))
angleSoFar += percentage
' Draws the lengend
g.FillRectangle(myBrushes(i), 350, 25 + (i * 50), 25, 25)
' Label the towns
g.DrawString("Town " & towns(i), New Font("Verdana", 8, FontStyle.Bold), Brushes.Brown, 390, 25 + (i * 50) + 10)
Next
The above code has to be linked with the Piechart Button's Click event.
Step 5
Now that we have the methods required to draw the charts, we should now output them on the browser. The piece of code below simply outputs the chart:
' Render the image to the HTML output stream.
myImage.Save(Response.OutputStream, _
System.Drawing.Imaging.ImageFormat.Jpeg)
Remember that myImage is the Bitmap object that we created earlier. Now, you can play around with the set of methods to produce other drawings or to improve the classes. You can also explore the rich set of methods and classes that the .NET framework provides you for producing drawings.
HostForLIFE.eu ASP.NET 5 Hosting
HostForLIFE.eu is European Windows Hosting Provider which focuses on Windows Platform only. We deliver on-demand hosting solutions including Shared hosting, Reseller Hosting, Cloud Hosting, Dedicated Servers, and IT as a Service for companies of all sizes. We have customers from around the globe, spread across every continent. We serve the hosting needs of the business and professional, government and nonprofit, entertainment and personal use market segments.