Prometheus is an open-source system monitoring and alerting toolkit. With this tool, we can monitor our application/services in production mode. In this article, we will create a simple ASP.NET Core application and will try to export some key metrics to the Prometheus server.

If you don't have any prior knowledge of Prometheus or you don't have Prometheus installed in Docker, please go through my other blog post "System Monitoring And Alerting With Prometheus (Docker)" where I have tried to give some general idea about Prometheus and the docker installation process.
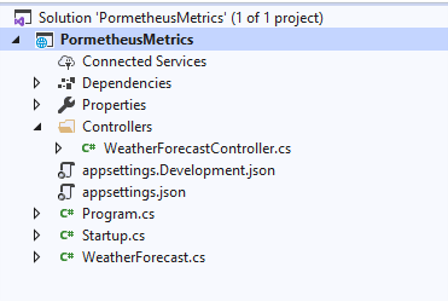
First, we will create an ASP.NET Core Web API Project.
From this service, we want to expose a basic set of metrics. The available .NET library is prometheus-net that comes with a companion ASP.NET Core Package. Run the following commands in the package manager console to install prometheus-net.
Install-Package prometheus-net
Bash
Install-Package prometheus-net.AspNetCore
Bash
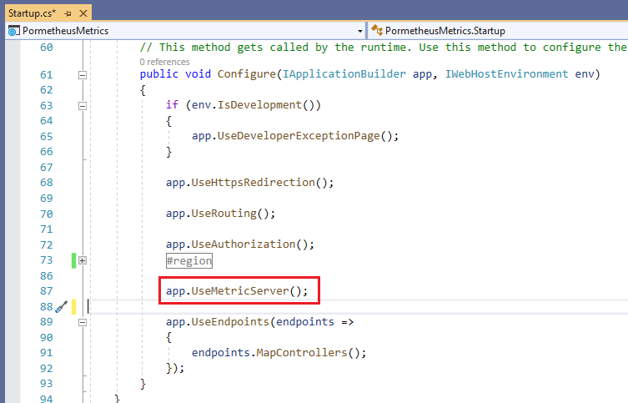
We can now start exposing a default set of metrics adding the following code inside the "Configure" method of the "Startup.cs" file.
N.B. Make sure to place this before the app.UseEndPoints() otherwise it may cause missing some important HTTP metrics.
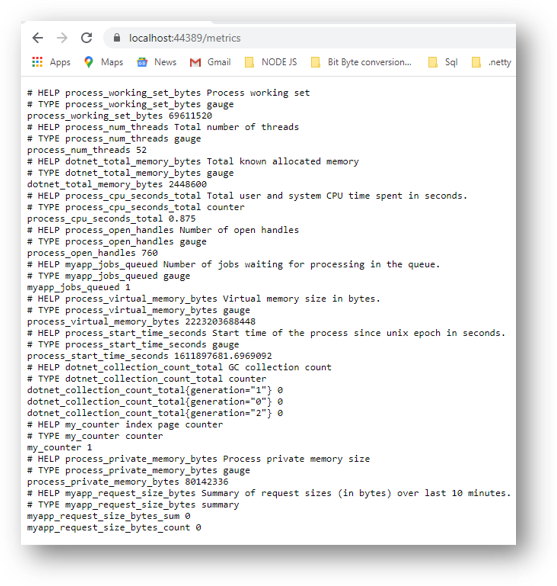
If we start our service and navigate to the "/metrics" endpoint, we can see a default set of metrics exposed by our service.
We can export HTTP metrics to Prometheus. For this, we need to add HttpMetrics middleware provided by "pormetheus-net".
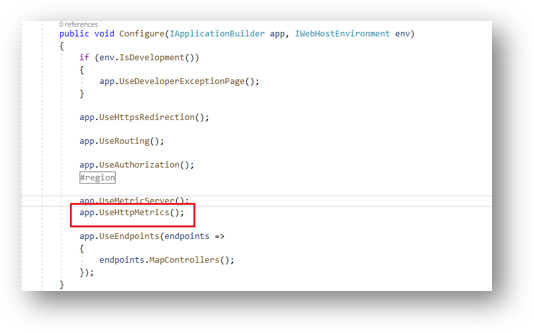
After adding this middleware if we navigate to the "/metrics" endpoint we can see the HTTP metrics have been exposed.
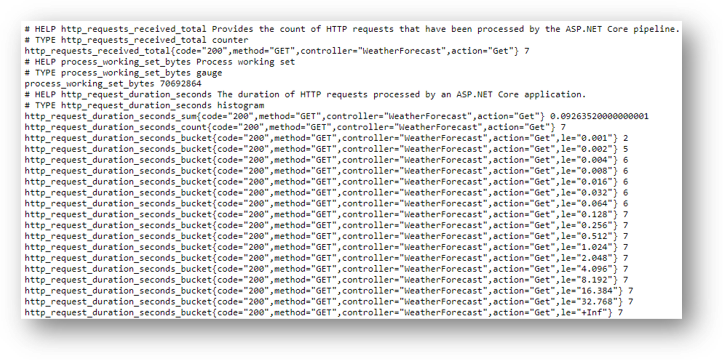
N.B. Like this HTTP Metrics, we can even export different Health Status Metrics, Network Health Status Metrics, .Net Core Runtime Metrics. But for simplicity's purpose, I am skipping it. But if you are interested you can go through these Nuget package documentation to have a clear understanding.
prometheus-net.AspNetCore.HealthChecks
prometheus-net.AspNetCore.HealthChecks
AspNetCore.HealthChecks.SqlServer
AspNetCore.HealthChecks.Network
prometheus-net.SystemMetrics
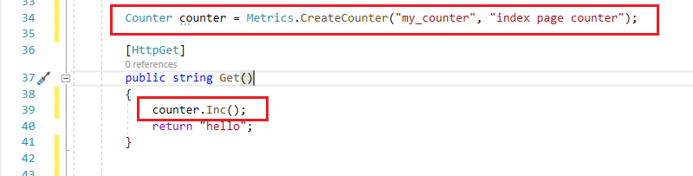
We can even export some Custom Metrics from our application. For example, we will create a very basic metric to track how many times any specific method is executed.
For this, we will simply go to one of our controllers and put the following code. By this code, we can track how many times this "Get()" method has been executed.
Now as we have instrumented our application with Prometheus and the metrics have been ready now we just need to send these metrics to the Prometheus(Docker) server. For this, we need to dockerize our application. For this, we need to add a "Dockerfile" in the root directory of our application. Dockerfile should contain the following code.
#See https://aka.ms/containerfastmode to understand how Visual Studio uses this Dockerfile to build your images for faster debugging.
FROM mcr.microsoft.com/dotnet/core/aspnet:3.1-buster-slim AS base
WORKDIR /app
EXPOSE 80
EXPOSE 443
FROM mcr.microsoft.com/dotnet/core/sdk:3.1-buster AS build
WORKDIR /src
COPY ["PormetheusMetrics/PormetheusMetrics.csproj", "PormetheusMetrics/"]
RUN dotnet restore "PormetheusMetrics/PormetheusMetrics.csproj"
COPY . .
WORKDIR "/src/PormetheusMetrics"
RUN dotnet build "PormetheusMetrics.csproj" -c Release -o /app/build
FROM build AS publish
RUN dotnet publish "PormetheusMetrics.csproj" -c Release -o /app/publish
FROM base AS final
WORKDIR /app
COPY --from=publish /app/publish .
ENTRYPOINT ["dotnet", "PormetheusMetrics.dll"]
Docker
And then need to run the following docker command from the root directory of our application. This command will dockerize our application in docker port 8085.
docker build -t netcore_prom .
docker run -d -p 8085:80 --name netcore_prom netcore_prom
Bash
After the application has been dockerized. We need to set this application as a target in our Prometheus server. For this, we need to do some changes in prometheus.yml file[Please follow my previous blog System Monitoring And Alerting With Prometheus (Docker)]. The prometheus.yml file should be edited as follows.
global:
scrape_interval: 30s
scrape_timeout: 10s
rule_files:
scrape_configs:
- job_name: services
metrics_path: /metrics
static_configs:
- targets: ['prometheus:9090']
- job_name: 'my-app'
static_configs:
- targets: ['host.docker.internal:8085']
YAML
Now if we re-run the Prometheus container as we have updated the "prometheus.yml",
docker-compose up -d
Bash
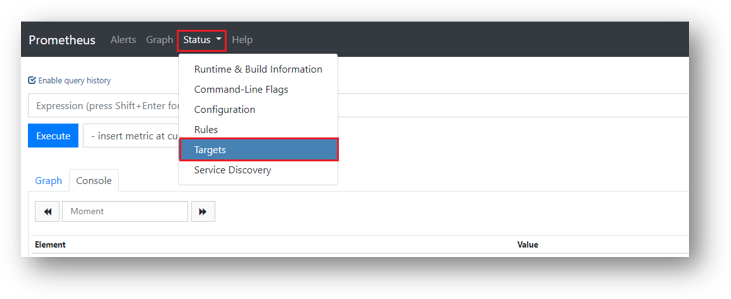
Now if we go to our Prometheus Web UI(http://localhost:9090) and click on the Targets we can see all our targets and their current status.
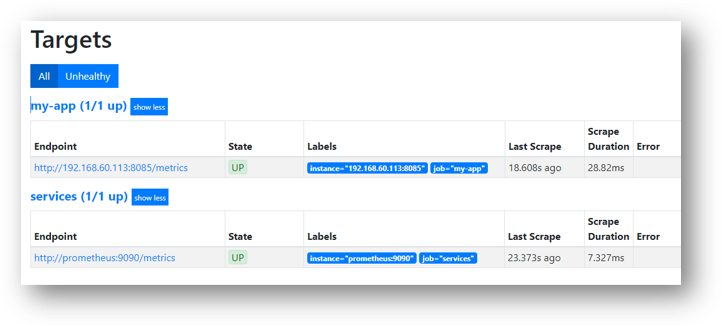
So here we can see that our Application (my-app) service is up and running.
We can even query for our exposed metrics in the Prometheus Web UI and see metrics.
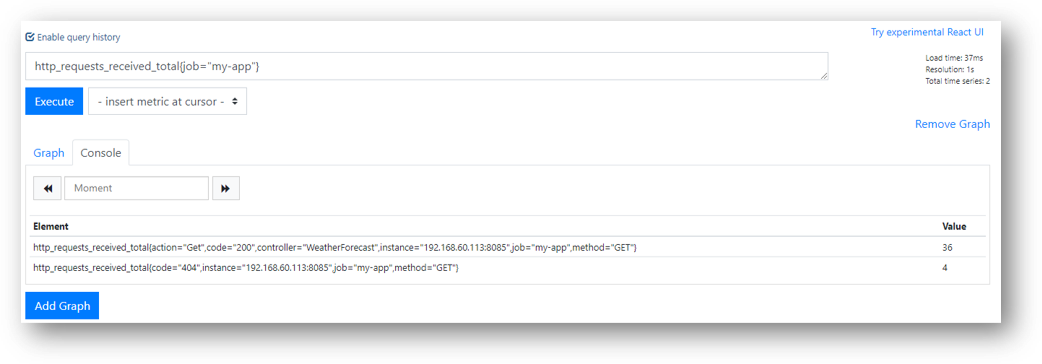
Just like this, we can query all the metrics that we have exposed from our application.
And with this, we finally export our metrics to the Prometheus server. Though this is a huge topic I just tried to keep this as simple as possible. But if you are interested further I would recommend going through the official website of the Prometheus there you will get to learn more about this.
In the next article, I will try to describe integrating Alert Manager with Prometheus.