The dream of every software engineer is to write a code in such a way that there won’t be any defects and none of the infrastructure will ever go down. But, that is not the case in the real world and with the Microservices architecture it has become even more difficult to identify the state of the container.

In fact, we need a mechanism in place to quickly identify and fix the issue at the earliest unless it turns out to be a bigger problem. This is where Health Monitoring comes into picture.
Health Monitoring in ASP.NET Core allows you to get near real-time state of the container. These monitoring mechanisms are handy when your application is dealing with components such as database, cache, url, message broker etc.
Implementing basic health monitoring
When developing ASP.NET Core Microservices, you can use a built-in health monitoring feature by using a nuget package Microsoft.Extension.Diagnostic.HealthCheck. These health monitoring features can be enabled by using a set of services and middleware.
public void ConfigureServices
(IServiceCollection services)
{
services.AddControllers();
services.AddHealthChecks();
}
public void Configure(IApplicationBuilder app,
IWebHostEnvironment env)
{
if (env.IsDevelopment())
{
app.UseDeveloperExceptionPage();
}
app.UseHttpsRedirection();
app.UseRouting();
app.UseAuthorization();
app.UseEndpoints(endpoints =>
{
endpoints.MapControllers();
endpoints.MapHealthChecks("/api/health");
}
}
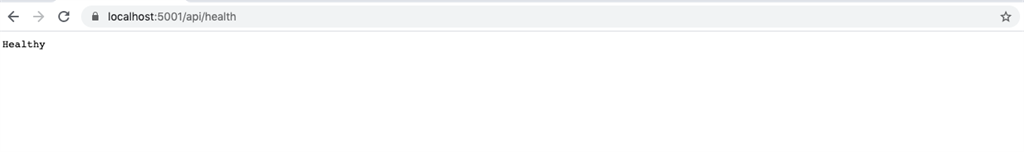
When you run the application, you will see the output as Healthy
Health Monitoring In ASP.NET Core
For two lines of code, not too bad. However, we can do much better.
Returning status in JSON format
By default, the output of the health monitoring is in “plain/text”. Therefore, we can see the health status as Healthy or UnHealthy. In order to see the detailed output with all the dependencies, the application has to be customized with “ResponseWriter” property which is available in AspNetCore.HealthChecks.UI.Client
Firstly, add the nuget package
dotnet add package AspNetCore.HealthChecks.UI
dotnet add package AspNetCore.HealthChecks.UI.Client
Now, let’s configure the application
endpoints.MapHealthChecks("/api/health",
new HealthCheckOptions()
{
Predicate = _ => true,
ResponseWriter = UIResponseWriter.
WriteHealthCheckUIResponse
});
Now, run the application and you will see the output in json format
{
"status": "Healthy",
"totalDuration": "00:00:00.0038176"
}
Health Status for URI’s
You can easily verify the status of the endpoints/uri’s by using nuget package
dotnet add package AspNetCore.HealthChecks.uris
Now, let's modify our code to accommodate the uri’s
public void ConfigureServices
(IServiceCollection services)
{
services.AddControllers();
services.AddHealthChecks()
.AddUrlGroup(new Uri
("https://localhost:5001/weatherforecast"),
name: "base URL", failureStatus:
HealthStatus.Degraded)
}
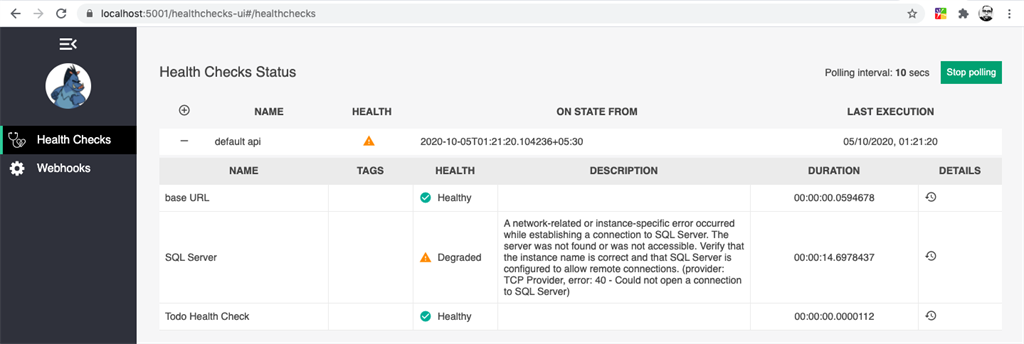
You need to use AddUrlGroup method to verify the uri’s and in case of failure, the status of the url will be displayed as Degraded.
Now, run the application and the output will look similar.
{
"status": "Healthy",
"totalDuration": "00:00:00.1039166",
"entries": {
"base URL": {
"data": {},
"duration": "00:00:00.0904980",
"status": "Healthy",
"tags": []
}
}
Health Status for SQL Server
In order to verify the status of SQL Server database, I did database installation in docker; however, you can use local instance of database server.
You can install SQL Server in docker using below commands
//Docker pull command to install
docker pull mcr.microsoft.com/mssql/server
//Docker Run command
docker run --privileged -e 'ACCEPT_EULA=Y'
-e 'SA_PASSWORD=Winter2019' -p 1433:1433
--name=MSSQL -d
mcr.microsoft.com/mssql/server:latest
Once the database is up and running, add the below nuget package.
dotnet add package AspNetCore.HealthChecks.SqlServer
public void ConfigureServices
(IServiceCollection services)
{
services.AddControllers();
services.AddHealthChecks()
.AddUrlGroup(new Uri("https://localhost:5001/weatherforecast"), name: "base URL", failureStatus: HealthStatus.Degraded) .AddSqlServer(Configuration.GetConnectionString("DefaultConnection"),
healthQuery: "select 1",
failureStatus: HealthStatus.Degraded,
name: "SQL Server");
}
Note
In the HealthQuery, don’t use any fancy queries to verify the Database connection. The main purpose of using “Select 1” is that it takes less execution time.
Now run the application and your output will look similiar.
{
"status": "Healthy",
"totalDuration": "00:00:00.1039166",
"entries": {
"base URL": {
"data": {},
"duration": "00:00:00.0904980",
"status": "Healthy",
"tags": []
},
"SQL Server": {
"data": {},
"duration": "00:00:00.0517363",
"status": "Healthy",
"tags": []
}
}
}
Custom Health Check
Custom Health Check can be easily implemented by using IHealthCheck interface.
public class TodoHealthCheck : IHealthCheck
{
public Task<HealthCheckResult> CheckHealthAsync(HealthCheckContext context, CancellationToken cancellationToken = default)
{
//Implement you logic here
var healthy = true;
if (healthy)
return Task.FromResult(HealthCheckResult.Healthy());
return Task.FromResult(HealthCheckResult.Unhealthy());
}
}
The AddCheck method in Configure services is used to add health check with the specified name.
public void ConfigureServices(IServiceCollection services)
{
services.AddControllers();
services.AddHealthChecks()
.AddUrlGroup(new Uri("https://localhost:5001/weatherforecast"), name: "base URL", failureStatus: HealthStatus.Degraded)
.AddSqlServer(Configuration.GetConnectionString("DefaultConnection"),
healthQuery: "select 1",
failureStatus: HealthStatus.Degraded,
name: "SQL Server")
.AddCheck<TodoHealthCheck>("Todo Health Check",failureStatus:HealthStatus.Unhealthy);
}
Now, run the application
{
"status": "Healthy",
"totalDuration": "00:00:00.0544065",
"entries": {
"base URL": {
"data": {},
"duration": "00:00:00.0527285",
"status": "Healthy",
"tags": []
},
"SQL Server": {
"data": {},
"duration": "00:00:00.0386450",
"status": "Healthy",
"tags": []
},
"Todo Health Check": {
"data": {},
"duration": "00:00:00.0001681",
"status": "Healthy",
"tags": []
}
}
}
Let’s visualize.
Display the output in the JSON format looks reasonable; however, visualizing the UI makes more sense and can be easily understandable for non-technical background people as well.
Add nuget package.
dotnet add package AspNetCore.HealthChecks.UI.InMemory.Storage
To visualize the UI health check, you need to amend changes in services and middleware.
public void ConfigureServices(IServiceCollection services)
{
services.AddControllers();
services.AddHealthChecks()
.AddUrlGroup(new Uri("https://localhost:5001/weatherforecast"), name: "base URL", failureStatus: HealthStatus.Degraded)
.AddSqlServer(Configuration.GetConnectionString("DefaultConnection"),
healthQuery: "select 1",
failureStatus: HealthStatus.Degraded,
name: "SQL Server")
.AddCheck<TodoHealthCheck>("Todo Health Check",failureStatus:HealthStatus.Unhealthy);
services.AddHealthChecksUI(opt =>
{
opt.SetEvaluationTimeInSeconds(10); //time in seconds between check
opt.MaximumHistoryEntriesPerEndpoint(60); //maximum history of checks
opt.SetApiMaxActiveRequests(1); //api requests concurrency
opt.AddHealthCheckEndpoint("default api", "/api/health"); //map health check api
})
.AddInMemoryStorage();
}
The Health Check UI endpoint comes by default as “/healthchecks-ui“. You can change this value by customizing it through the MapHealthCheckUI method.
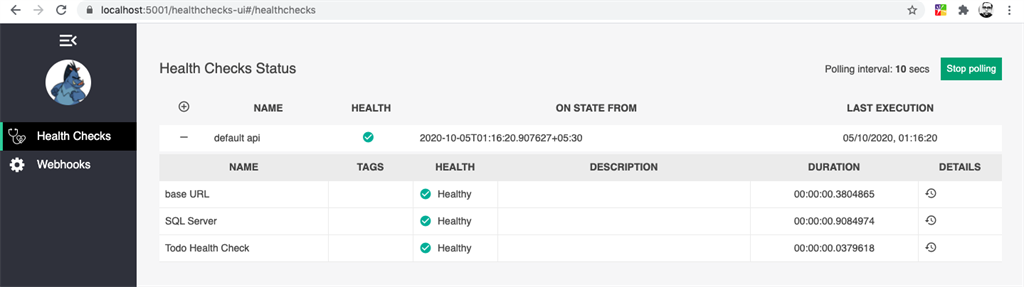
In the code, I have set the polling interval as 10 seconds. It checks whether all the endpoints/databases etc within the application are working as expected.
Now run the application.
Health Monitoring In ASP.NET Core
Now, let’s stop the SQL Server from Docker container and verify the output
//Get Container ID
docker ps
//Stop Docker container for SQL Server
docker stop <Container Id here>
Health Monitoring In ASP.NET Core
Other Health checksFeatures.