Response caching is the technique by which a browser or other client stores a server's response in memory. As a result, requests for the same resources will be processed more quickly in the future. Additionally, this will spare the server from processing and producing the same response over and over again. ASP.NET Core uses the ResponseCache property to set the response caching headers. Moreover, we can use the Response Caching Middleware to control the caching behavior from the server side. Once we've configured clients and other proxies to determine how to cache the server response, they can read the response caching headers. The HTTP 1.1 Response Cache Specification stipulates that browsers, clients, and proxies need to have caching headers.
What Does "caching" Mean?
The process of temporarily storing frequently used data so that it can be rapidly retrieved is known as caching. The application's overall speed will be improved because there won't be as much need to fetch the same data from the database or other storage devices.
ASP.NET Core Caching Types
- Multiple Caching Mechanism Types are Supported by ASP.NET Core. They are listed in the following order.
- In-Memory Caching: The most basic type of caching, in-memory caching works well with a single server. The main memory of the web server houses the data. It is quick and appropriate for data that doesn't require persistence past the web server process' lifetime or require a lot of memory. It works well for storing modest volumes of information.
- Distributed Caching: Applications that must share data across multiple servers in load-balancing or multi-server environments are best suited for distributed caching. It entails keeping data in an external system, like NCache, SQL Server, Redis, and so forth. Although it requires more work than in-memory caching, large-scale applications must use it to guarantee consistency between requests and sessions.
- Response Caching: Response Caching is the process of keeping the result of a request-response cycle in the cache in order to serve the resource from the cache in response to subsequent requests rather than having to generate the response from scratch. This method can greatly enhance the performance of a web application, particularly for resources that are costly to produce and don't change frequently.
HTTP Based Response Caching
Now let's talk about the different HTTP Cache Directives and how to control the way caching behaves. Cache-control is the primary header parameter that we utilize to specify whether or not a response can be cached. The cache-control header should be respected and adhered to by clients, proxy servers, and browsers when it shows up in the response.
Let's now examine the standard cache-control directives.
- public: denotes the ability for a cache to hold the response locally on the client or in a shared location.
- private: denotes that the response may only be stored in a client-side private cache and not in a shared cache.
- no-cache: The no-cache flag instructs a cache not to respond to any requests with a stored response.
- no-store: The no-store flag instructs a cache not to keep the answer.
Browsers and clients understand no-cache and no-store differently, despite the fact that they sound and even behave similarly. We will discuss this in more depth as we go through the instances.
A few more headers, in addition to cache control, can regulate the caching behavior.
For backward compatibility with the no-cache directive and the HTTP 1.0 specification, the pragma header is used. It will disregard the pragma header if we supply the cache-control header.
Vary: This tells it that it can only send a cached response if every field in the header precisely matches the request that came in before. A new response is generated by the server if any of the fields are modified.
Illustrations of HTTP Cache Directives
We will now create an ASP.NET Core application to demonstrate how the cache directives work. Now let's add a controller action method to an ASP.NET Core Web API project that has been created.
public record EmployeeDto
{
public Guid Id { get; init; }
public string Name { get; init; }
public EmployeeType Type { get; init; }
public string Mno { get; init; }
public decimal Salary { get; init; }
public DateTime CurrentDate { get; init; } = DateTime.Now;
}
[HttpGet("{id}")]
public IActionResult GetById(Guid id)
{
var emp = _employeeService.GetById(id);
if (emp == null)
{
return NotFound();
}
return Ok(emp);
}
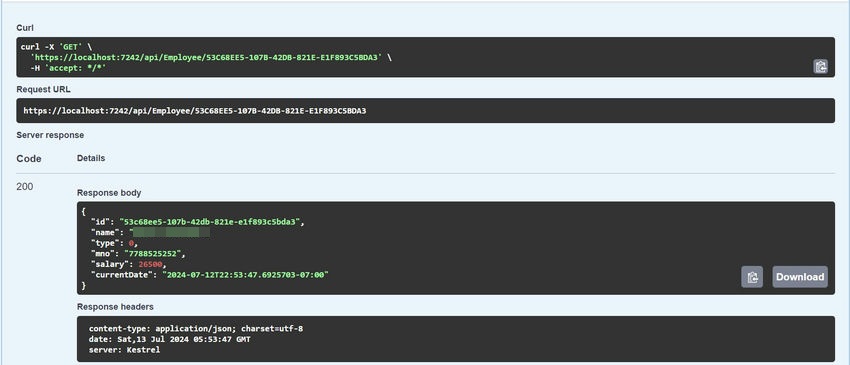
ResponseCache Attribute
The ResponseCache attribute for an ASP.NET Core application specifies the properties for configuring the relevant response caching headers. This attribute can be used for specific endpoints or at the controller level.
Let's update the API endpoint with the ResponseCache attribute.
[HttpGet("{id}")]
[ResponseCache(Duration = 120, Location = ResponseCacheLocation.Any)]
public IActionResult GetById(Guid id)
{
var emp = _employeeService.GetById(id);
if (emp == null)
{
return NotFound();
}
return Ok(emp);
}
The max-age header, which we use to set the cache duration for two minutes (120 seconds), is produced by this Duration property. In a similar manner, the cache-control header's location will be set by the Location property. Both the client and the server will be able to cache the response because we have the location set to Any, which is similar to the public directive of the cache-control header.
Let us now access the API endpoint and confirm these contents within the response headers.
cache-control: public,max-age=120
Furthermore, if the browser uses a cached response after we repeatedly invoke the endpoints, the response from the disk cache will be indicated in the status code.
200 is the status code (from disk cache).
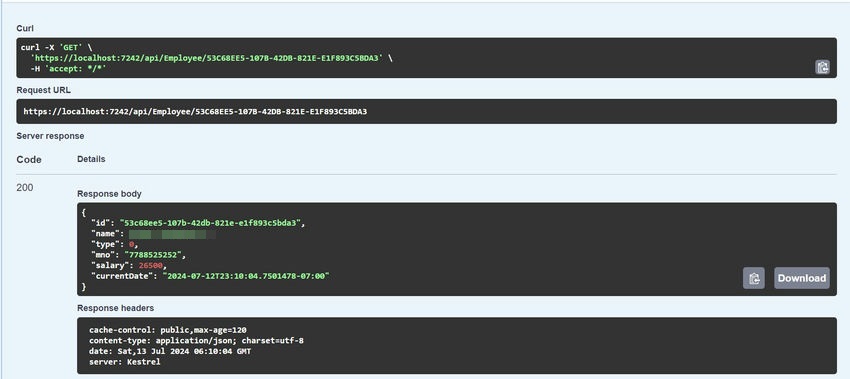
Let's now examine the various ResponseCache parameter options.
All we have to do is update the Location property to ResponseCacheLocation.Client in order to change the cache location to private.
[ResponseCache(Duration = 60, Location = ResponseCacheLocation.Client)]
By doing this, the cache-control header value will be altered to private, indicating that the response can only be cached by the client.
cache-control: private,max-age=60
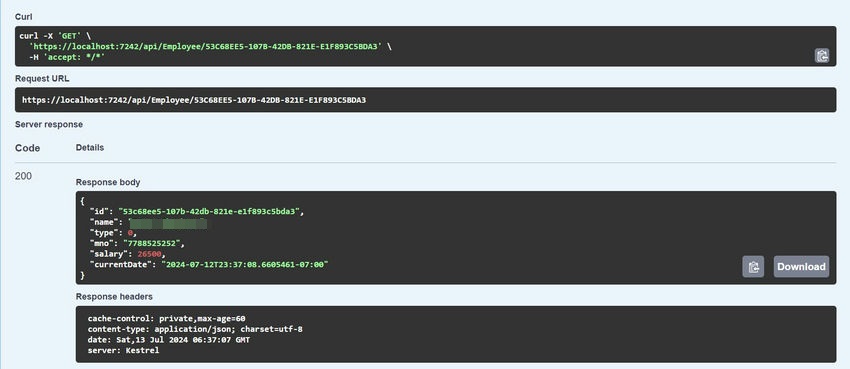
Let's now change ResponseCacheLocation.None as the Location parameter:
[ResponseCache(Duration = 60, Location = ResponseCacheLocation.None)]
This will cause the client to be unable to use a cached response without revalidating with the server, as it will set the cache-control and pragma headers to no-cache:
We can confirm that the server always generates a fresh response in this configuration, and the browser never uses the cached response.
cache-control: no-cache,max-age=60
We can confirm that the server always generates a fresh response in this configuration, and the browser never uses the cached response.
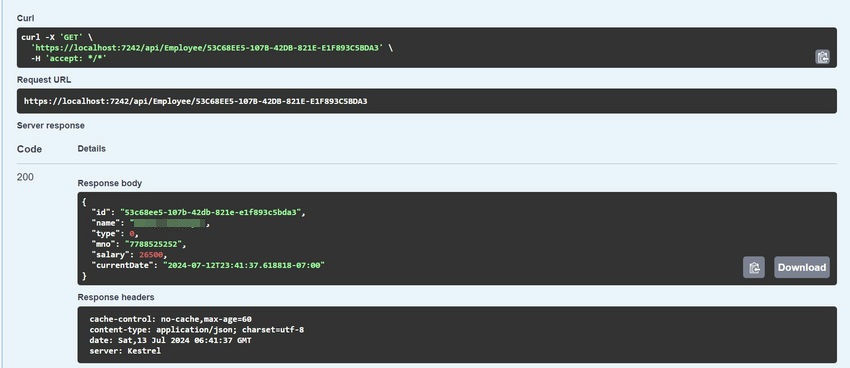
NoStore Property
Let's now set the ResponseCache attribute's NoStore property to true.
[ResponseCache(Duration = 60, Location = ResponseCacheLocation.Any, NoStore = true)]
This will cause the response's cache-control header to be set to no-store, telling the client not to cache the response.
cache-control: no-store
Keep in mind that this will take precedence over the Location value we set. The client won't save the answer in its cache in this instance either.
Though the cache-control no-cache and no-store values might produce identical test results, different browsers, clients, and proxies interpret these headers in different ways. No-cache simply means that the client should not use a cached response without revalidating with the server, whereas no-store instructs clients or proxies to not store the response or any portion of it anywhere.
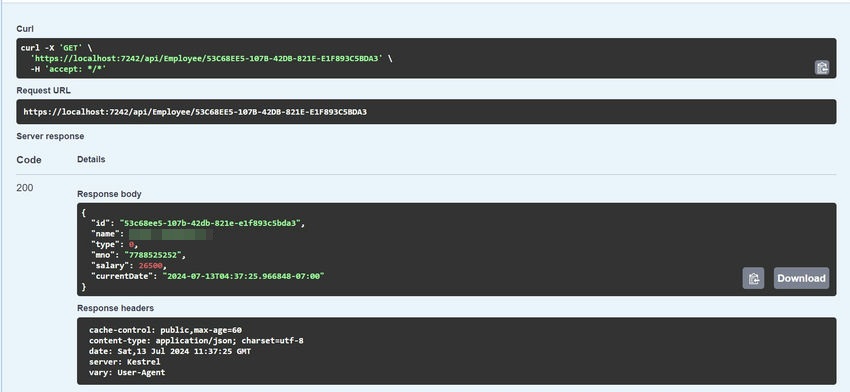
The VaryByHeader property of the ResponseCache attribute can be used to set the vary header.
[ResponseCache(Duration = 60, Location = ResponseCacheLocation.Any, VaryByHeader = "User-Agent")]
Here, we set the VaryByHeader property to User-Agent, which means that if the request originates from the same client device, it will use the cached response. The User-Agent value will alter and the client device will request a fresh response from the server. Let us confirm this.
Let's first see if the response headers contain the vary header.
cache-control: public,max-age=60
vary: User-Agent


Consequently, we can force the server to send a fresh response for a different device by configuring the VaryByHeader property to User-Agent.
VaryByQueryKeys Property
When the specified query string parameters change, we can force the server to send a new response by utilizing the VaryByQueryKeys property of the ResponseCache attribute. Naturally, if we set the value to "*," we can create a fresh response each time a query string parameter changes.
For instance, if the ID value in the URI changes, we might want to produce a fresh response.
…/emp?id=53C68EE5-107B-42DB-821E-E1F893C5BDA3
…/emp?id=6E5692FA-EEF6-426A-B280-EF444CB2BA1E
To do this, let's alter the Get action to add the id parameter and supply the ResponseCache attribute's VaryByQueryKeys property.
[ResponseCache(Duration = 60, Location = ResponseCacheLocation.Any, VaryByQueryKeys = ["id"])]
Recall that in order to set the VaryByQueryKeys property, we must activate the Response Caching Middleware. The code will raise a runtime exception if it doesn't.
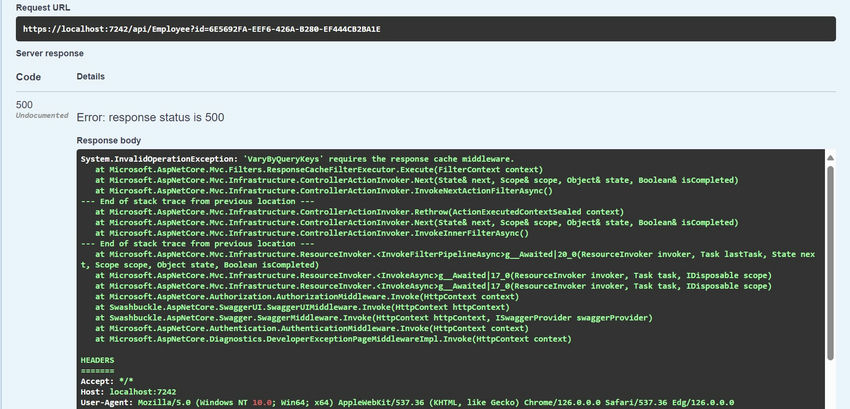
Response Cache Middleware
When a response can be cached, the ASP.NET Core application's Response Caching Middleware establishes this and stores and serves the response from the cache.
The Response Caching Middleware can be enabled by adding a few lines of code to the Program class.
// service inject
builder.Services.AddResponseCaching();
// in the middleware
app.UseResponseCaching();
Using the AddResponseCaching() method, we must first add the middleware. Afterwards, we can use the UseResponseCaching() method to configure the application to use the middleware.
That is all. Now that the Response Caching Middleware has been turned on, the VaryByQueryKeys property ought to function.
Now that the application is running, let's check the response cache.
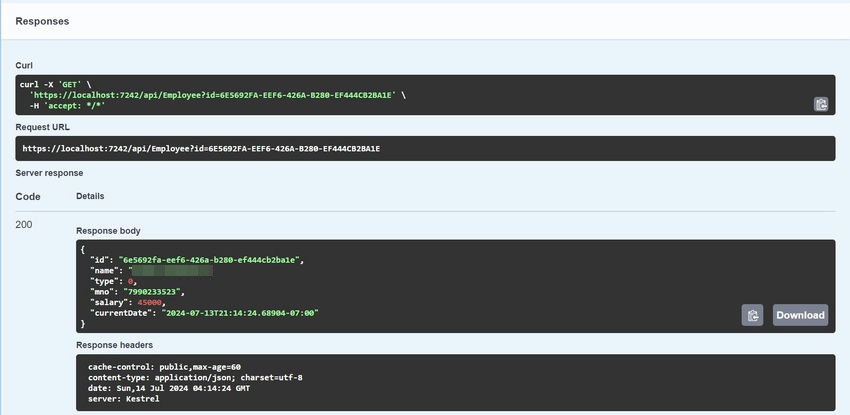
It is evident that if the query string remains unchanged, we will receive a cached response; however, if we modify the query string, the server will send a fresh response. Let's examine the response cache and modify the value of the query string.

Take note that the VaryByQueryKeys property does not have a corresponding HTTP header. Response Caching Middleware oversees managing this HTTP feature.
We learned the new technique and evolved together.
Happy coding!
European Best, cheap and reliable ASP.NET hosting with instant activation. HostForLIFE.eu is #1 Recommended Windows and ASP.NET hosting in European Continent. With 99.99% Uptime Guaranteed of Relibility, Stability and Performace. HostForLIFE.eu security team is constantly monitoring the entire network for unusual behaviour. We deliver hosting solution including Shared hosting, Cloud hosting, Reseller hosting, Dedicated Servers, and IT as Service for companies of all size.
